Leveraging Facebook's advertising platform to monitor stocks of migrants
Emilio Zagheni, Igmar Weber, and Krishna Gummadi, 2017
This paper presents Facebook’s marketing API as a tool for social science research and demonstrates the value of this tool for measuring migrant stocks in the US and internationally. The API enables advertisers to programmatically purchase ads on the platform. Before advertisers purchase an ad targeting a particular demographic group, Facebook provides an estimate of the number of monthly active users in that group. The authors give the example of an ad targeting Italian expats aged 18 and over living in the state of Washington. Facebook estimates there are 3,800 such users. By programmatically calling this API and requesting reach estimates, one can construct a detailed demographic picture of the Facebook population.
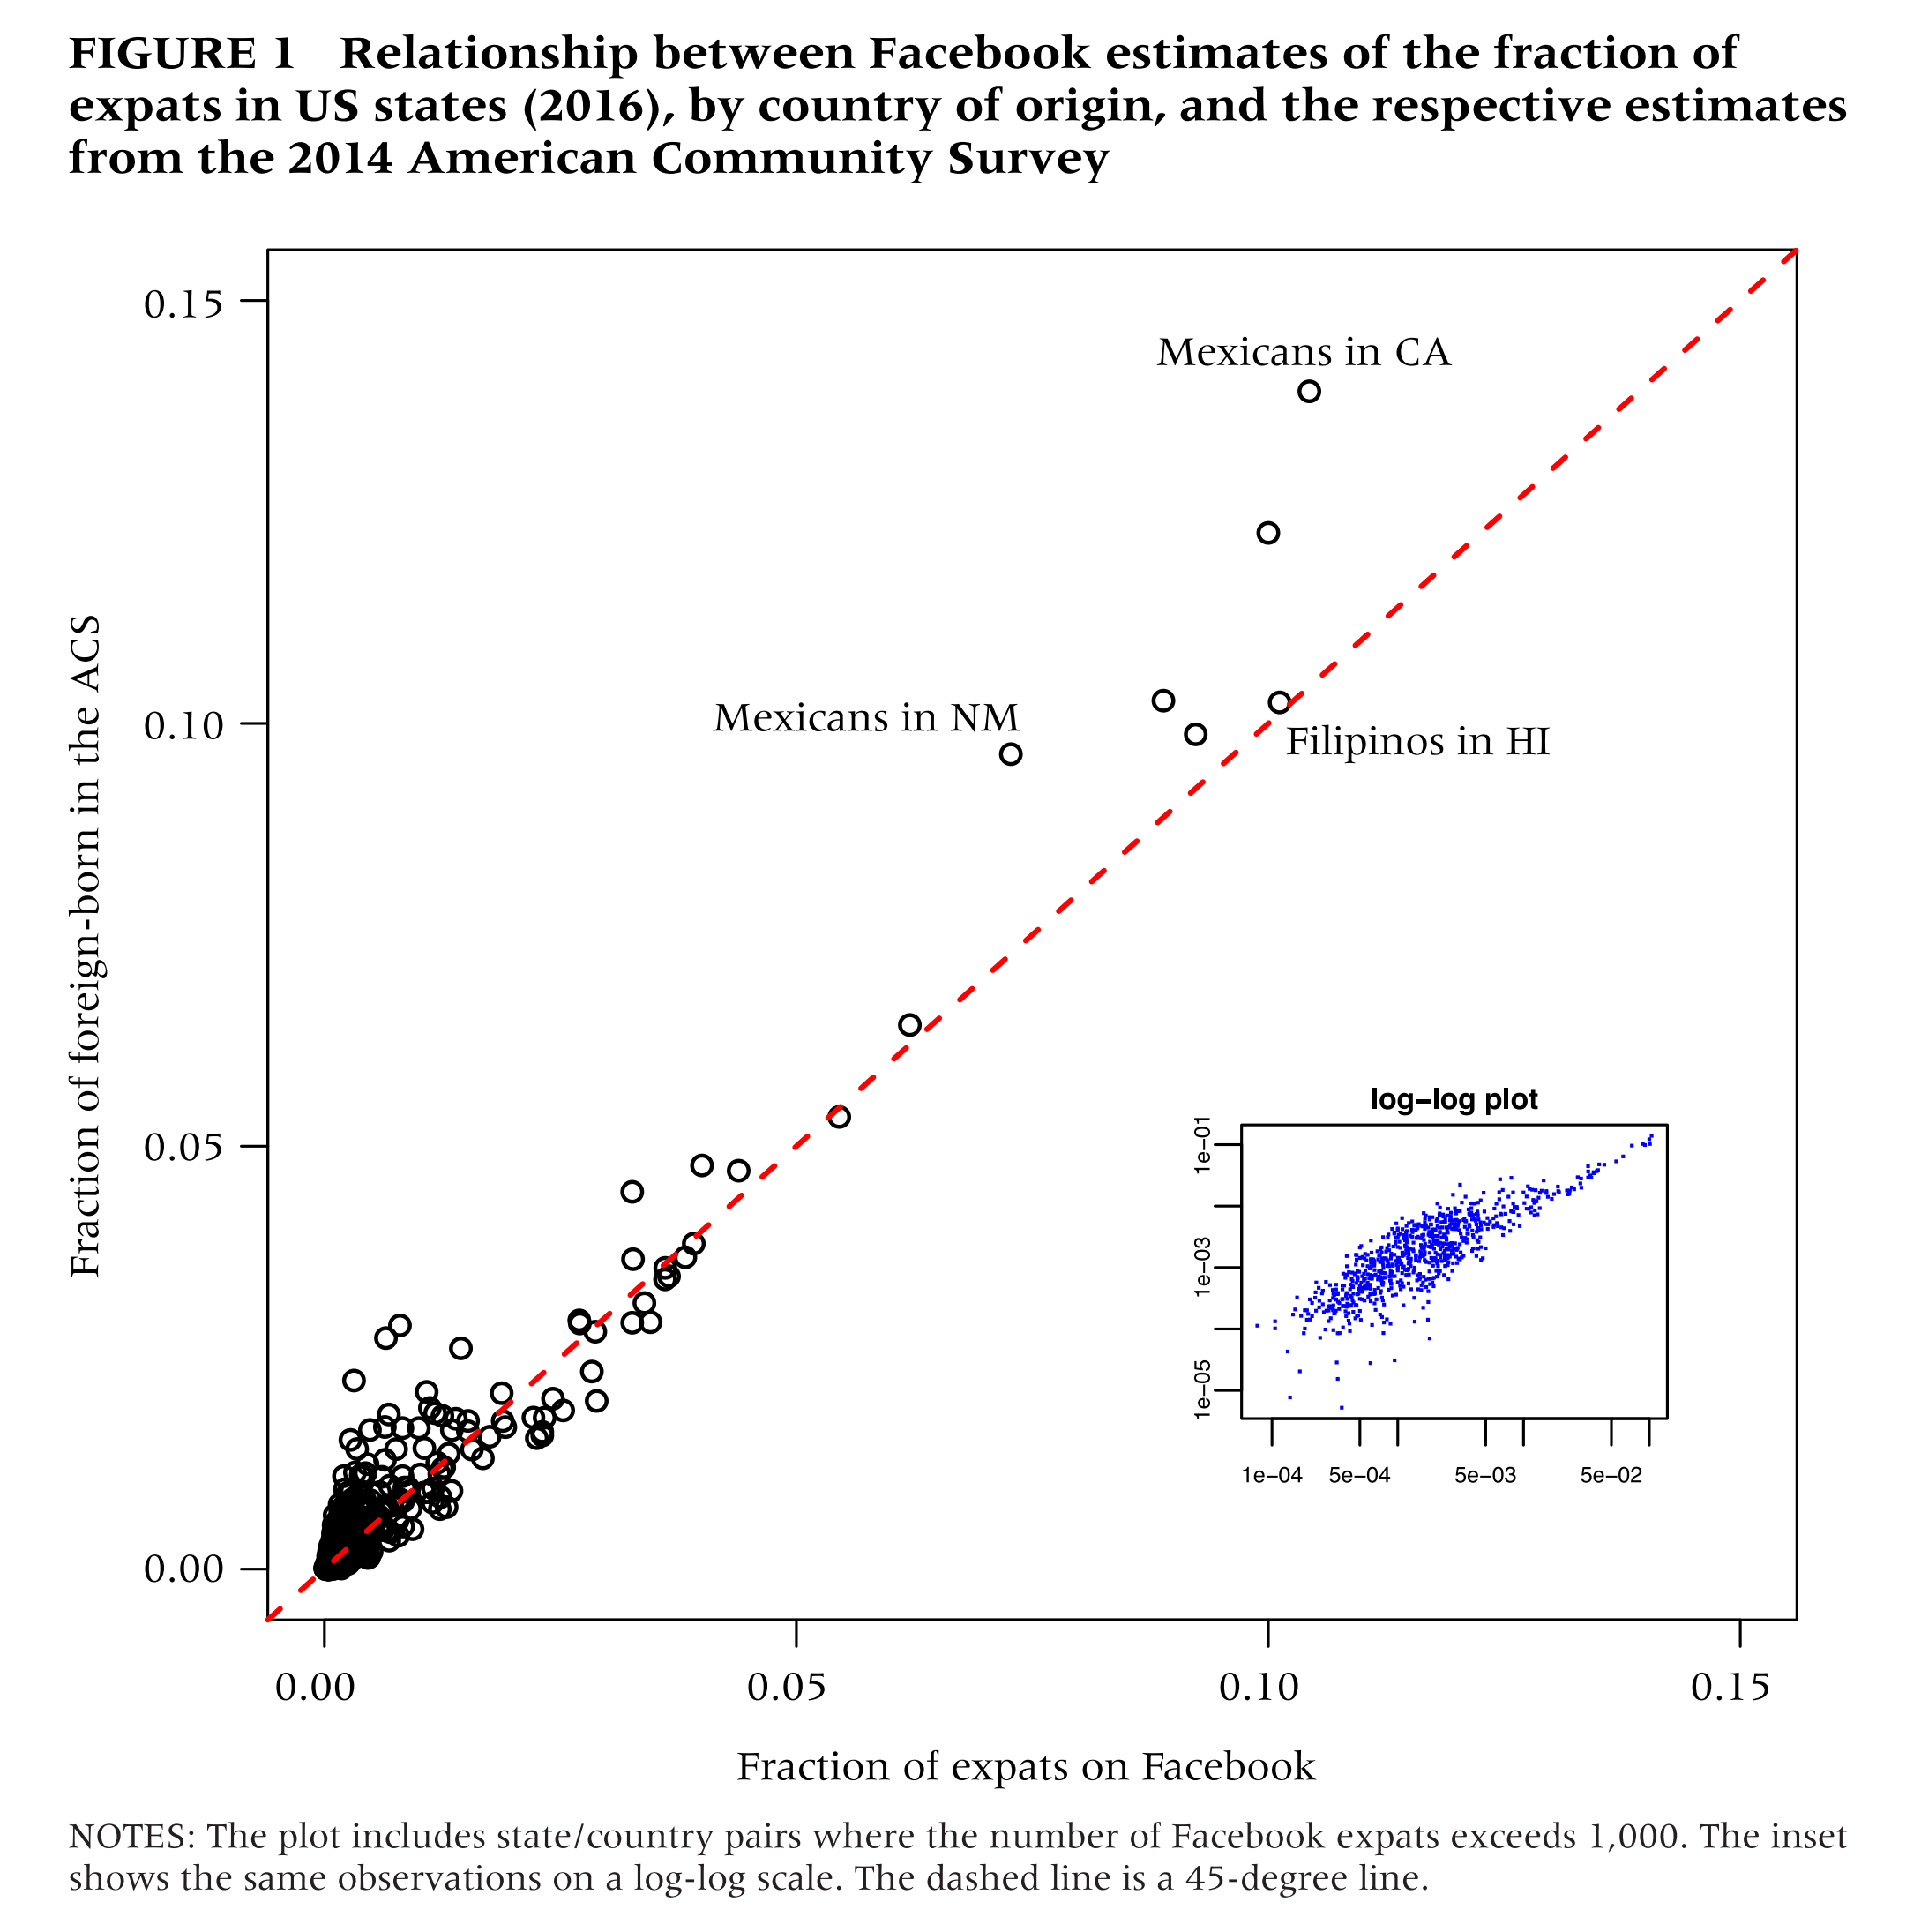
This data source holds great potential since it is available on a monthly basis and it is decomposable to small geographies and narrowly defined subgroups. To realize this potential, however, it must either be representative of the underlying population, or amenable to adjustment so that it reflects the underlying population. The plot below shows the correspondence between Facebook estimates and ACS estimates of the number of expats from different countries currently living in different US states. The Facebook data explains 94% of the variation in the ACS, which suggests a fairly strong correspondence.
The authors go on to decompose the bias in the data across age and country of origin, and fit a linear model to calibrate the biases within each country-of-origin by age subgroup. They show that estimates produced by predicting based on the fitted regression model yield 34% lower errors than the naive estimates.
As far as I can tell, there isn’t really a paper outlining how to introduce a new dataset with potential demographic estimation. Such a paper probably out to be written. In the absence such a pedagogical paper, I think this one does a good job laying out the necessary things to cover:
- Describe how the data are collected, and why it is potentially useful
- Plot out how the data compare to some ground truth estimate (probably from a Census)
- Assess the extent to which the data can be calibrated against these ground truth data.
In some ways, this feels like the bare minimum. It’s probably always better to include specific applications that demonstrate the value of the data over and above existing measures. At the same time, Emilio Zagheni and co. have shown here that a valid approach is to first publish this kind of introductory paper, and then follow up with future papers focussing on specific applications (eg. nowcasting (Alexander, Polimis, and Zagheni, 2020), capturing migration shocks (Alexander, Polimis, and Zagheni, 2019)).