Analyzing the Effect of Time in Migration Measurement Using Geo-referenced Digital Trace Data
Lee Fiorio and co-authors, 2020
This paper develops a general framework for using geo-located digital trace data to estimate migration flows over a continuous time interval. The goal is to develop a framework that makes digital trace data useful for migration, even through most of it takes the unusual form of (id, timestamp, location). For example, if we want to use geo-located Tweets to measure migrant flows, all we have are the locations of users at the times when they Tweet. This makes it difficult to capture any notion of “residency”. And how should we differentiate short trips and vacations from actual moves in the data?
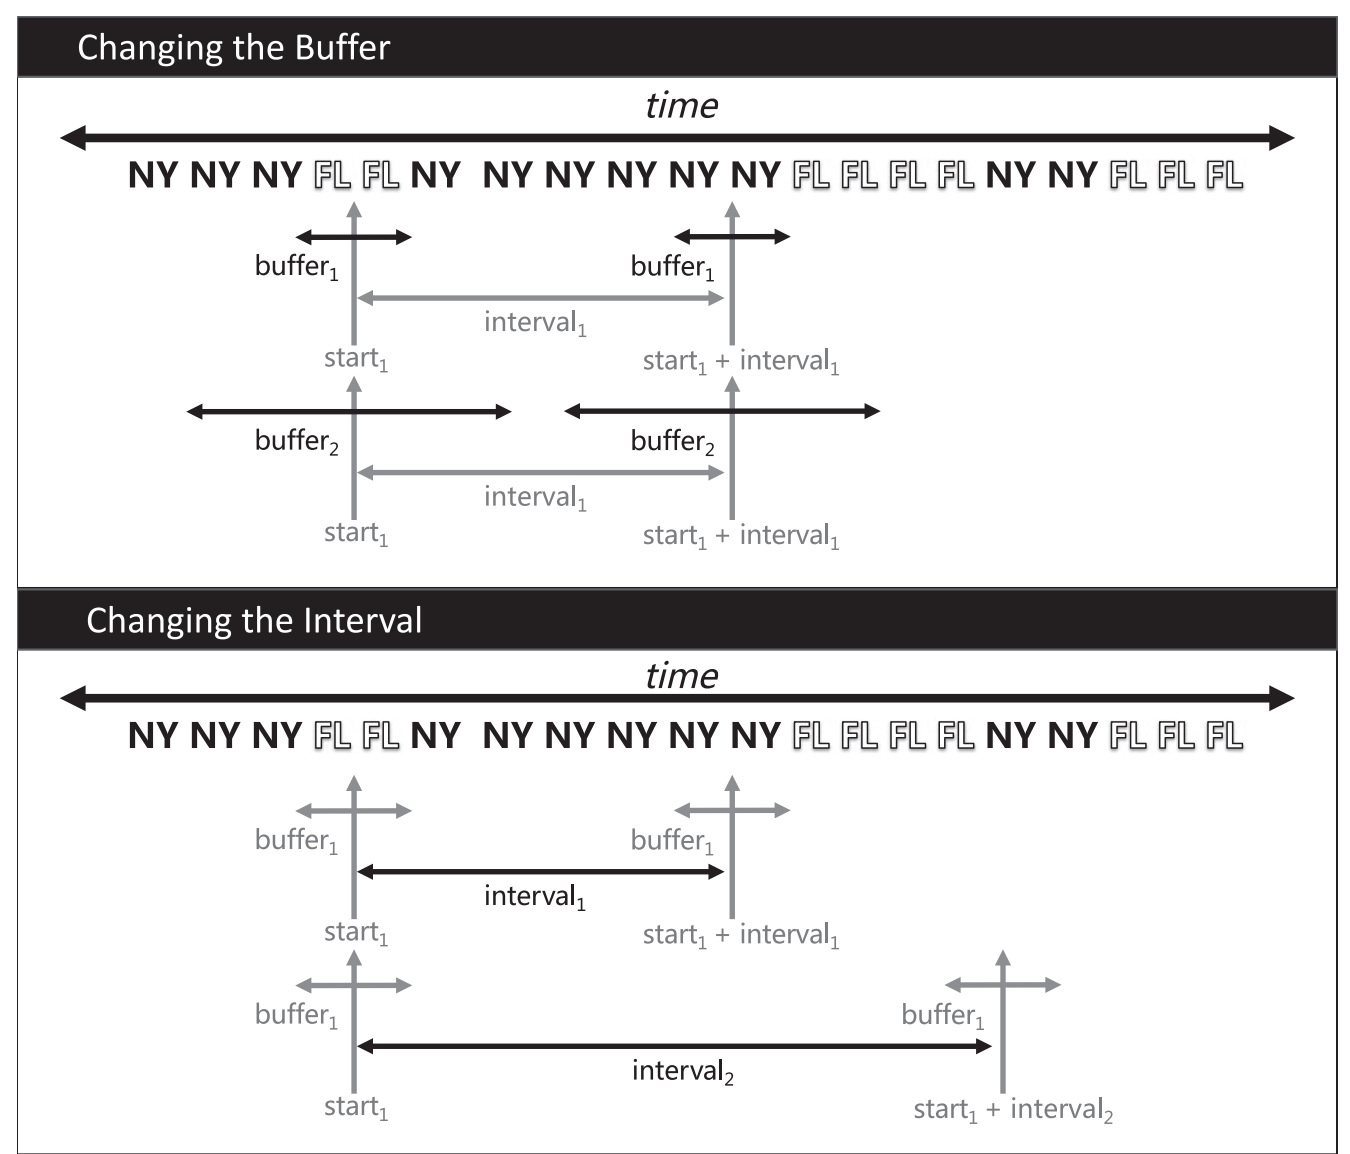
The idea presented in the paper is to address this problem by examining changes in location across a range of intervals using the same data. The steps are as follows:
- Pick a start date a buffer size (eg. 2 weeks)
- Search the data around the start date within the buffer, and get the locations of all users.
- Pick another time in the future. The difference between this time and the starting time is called the ‘interval’ Using the same buffer, find everyone again and record their new location.
- Compute flows between the two points in time.
- Repeat steps 3 and 4 using many different future time points.
- Repeat steps 1-5 for many different buffer sizes.
Visually, the procedure looks like this:

The authors argue that by manipulating the data in this way, we can extract more information about migration from the data. By expanding the buffer we should observe that estimates become less variable over time, since they should increasingly reflect only long-term moves. By moving further out in time, we should find that migration estimates increase.
Further, the authors argue that this approach enables assessing the internal consistency of a particular digital trace dataset. If we observe that slight changes to the interval (eg. 1 week) yield large changes in estimated transitions, this suggests the data might mostly be capturing short trips rather than vacations. The approach is demonstrated on three different digital trace datasets:
Orange-Sonatel 2014 Data for Development Challenge data, which contain phone calls and SMS exchanges between nine million Orange-Sonatel customers in Senegal throughout 2013.
Twitter data pulled from a 1% stream sample archived at Archive.org. The archived data from 2011 through 2014 are used because after 2014, Twitter stopped releasing location inforamtion about Tweets.
Data from Gowalla, which is a geosocial network like Foursquare, where people log on to share their locations. The platform was short-lived, and the data consist of roughly 6.5 million check-ins from 2010 and 2011.
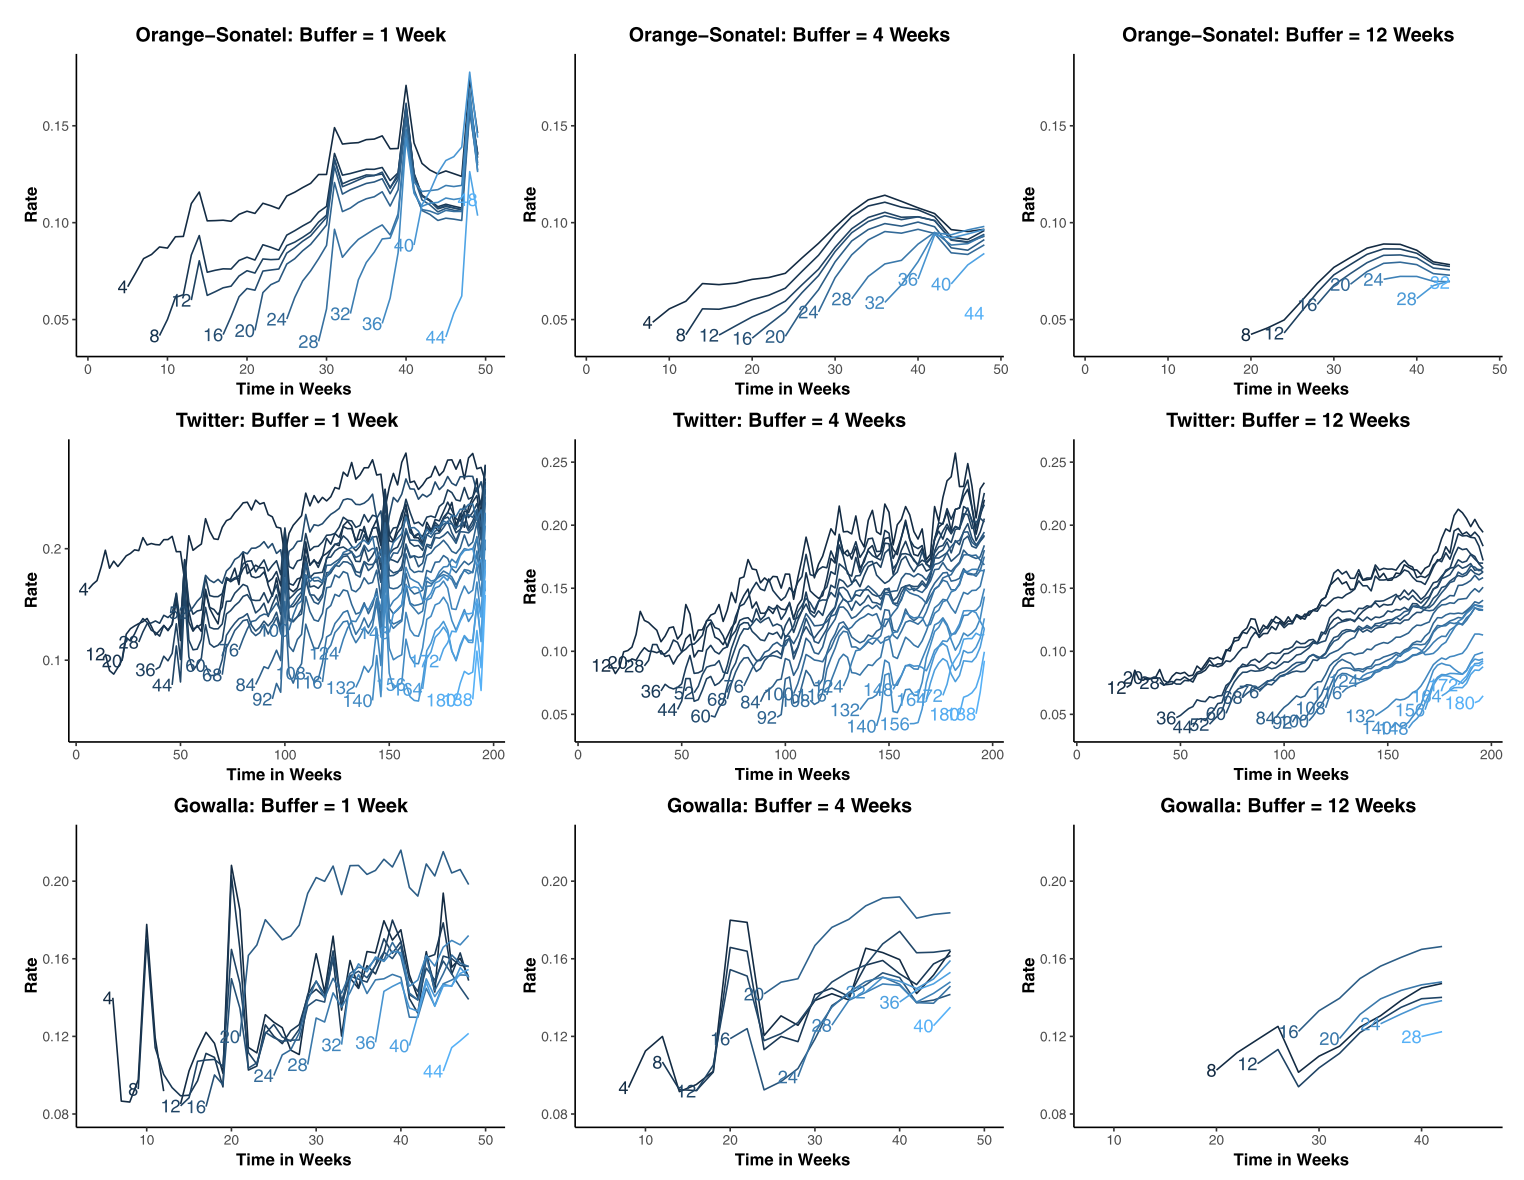
The demonstration of the method is impressive:

Each panel shows the result of applying the model with a fixed buffer. Each line represents starting at a time and moving forward taking longer and longer intervals. The y-axis shows the migration rate.
The results look exactly like what we would expect. As the interval grows from any time point, the estimated rate of migration goes up. This makes sense, since more people had time to migrate and people who move don’t often come back. Also as expected, increasing the buffer smoothes out the estimates at consecutive time points.
This is a really straightforward, simple to implement method of getting meaningful information about migration from geo-located digital trace data. The authors say they intend for this to be a sort of internal consistency technique that can be paired with typical validation approaches of comparing data against established sources. So this procedure is thought to be analogous to computing the perplexity of a language model, or the Cronbach’s alpha for a series of self-report items. It’s unclear to me whether this technique really fits as a measure of internal consistency, though. I’m struggling with it because all the examples in the paper yield the same basic conclusions about the effect of varying the buffer and the interval, which suggests these effects might be more mechanical features of the method than features of the underlying data. I suppose I would want to see examples where using this approach actually identifies a problem in digital trace data, which I’m not really seeing here. Moreover, the method really only gives these visual representations of the data, like the plots about. I might prefer instead to have some kind of metric that sums up the sensitivity of the data to the parameters in the framework.
Nonetheless, the paper is really cool and creative. I think there are lots of ways to build out from this base and develop a whole set of methods around using data with this type of structure to measure mobility. I also think it’s really valuable that digital trace data break down our notion of migration as being only about changes in residency, and enforces a more fluid understanding of migration as being about one’s location at a given point in time, and frequency of transitions. As people become increasingly mobile and remote work starts to become more common, we might need to rethink the current treatment of residency as central to migration measurement.