Measuring Economic Policy Uncertainty
Scott Baker, Nicholas Bloom, and Steven Davis, 2016
The field of natural language processing has exploded in recent years as researchers constantly try to one-up each other by inching closer to perfect performance with increasingly complex neural architectures. In the meantime, Baker, Bloom, and Davis have constructed a highly impactful measure of economic policy uncertainty (EPU) using a basic keyword search.
The index is so simple: Just count up the number of “articles in 10 leading U.S. newspapers that contain the following trio of terms: ‘economic’ or ‘economy’; ‘uncertain’ or ‘uncertainty’; and one or more of ‘Congress,’ ‘deficit,’ ‘Federal Reserve,’ ‘legislation,’ ‘regulation,’ or ‘White House.’” (p.1594). That’s it. That’s the index1.
What’s so impressive about this paper is a) the qualitative effort that went into establishing the face validity of the measure, and b) that despite its simplicity, the authors are able to demonstrate its utility in very rigorous and compelling ways. I’ll talk about each of these.
The authors document and the incredibly labor-intensive coding procedure they used to narrow in on their list of keywords. The process involves multiple rounds of audits by dozens of research assistants and a 65-page guidebook. Through auditing, they labeled a sizeable number of documents and narrowed in on a set of candidate keywords. Then, they constructed indices from every possible combination of keywords in their list and tested which permutation most closely match the hand-labeling of documents. The best-fitting set of keywords matches up with the hand-labeled index like this:
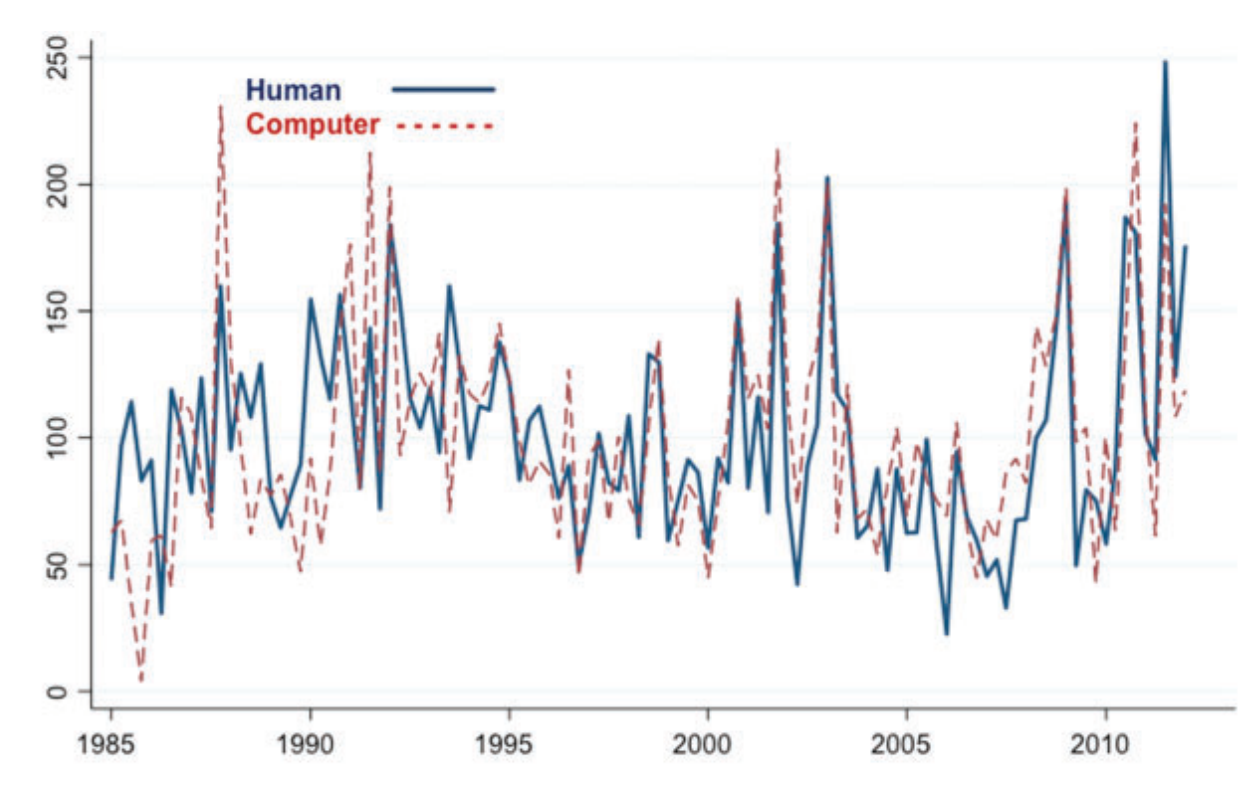
Obviously a strong correlation. They also include appendices that show the effect of dropping any single keyword from the list is minimal. All in all, this is a model of rigorous text-based measure construction. And amazingly it doesn’t involve any fancy NLP techniques at all.
The authors also do an incredible job of demonstrating that the index has practical applications and fits within existing economic frameworks as expected. They cover the basics of establishing convergent validity by showing that the EPU index correlates with other measures of uncertainty. They do this first using a measure of option price volatility. They also use the frequency of the word “uncertain” in the ‘Beige Book’, which is a 15,000 word document released eight times a year by the Federal Open Market Committee and summarizes the concerns expressed by businesses to the major Federal Reserve Banks across the U.S. They also do a similar analysis of firms’ 10-K filings (which are basically annual reports that include more financial details).
But they don’t stop there! Going even further, the authors note that firms should differ in their exposure to policy uncertainty depending how much of their revenues come from government contracts. This motivates a validation exercise using firm-level data in a shift-share type setup. They use private and public data on Federal contracts to measure industry-level exposure policy uncertainty as the share of industry revenue that comes from government contracts2.
Using these exposure measures, they fit a regression model of firm option volatility on the interaction between exposure and the national EPU index, while including firm and time fixed effects in the model. The coefficient on the interaction implies that “for every 1% increase in our policy uncertainty index a firm with, say, a 50% government revenue share would see its stock volatility rise by 0.11%” (p. 1620).
What’s so powerful about this last result is how closely it ties the EPU measure to such a specific outcome - the implied volatility within firms most affected by government fiscal policy. I think this paper really has it all when it comes to presenting and validating measures based on unique data.
Okay, it’s a little more complicated than that. First, the article frequencies are normalized to account for variation over time and across magazines in the number of articles published. Also, this keyword-based index is the main version, but there are two others. The first measures the current price of assets that pay out based on future government fiscal policy, and the second measures disagreement between professional forecasters of future government purchases. In the paper, however, only the keyword-based index is presented.↩︎
“At the top end, firms operating in the guided missiles and space vehicles and parts industry (SIC 376) derive 78% of their revenues from sales to the federal government. The corresponding figure for selected other industries with high exposures to federal purchases is 39% for ordnance and accessories (SIC 348); 27% for search, detection, navigation, guid- ance & aeronautical systems (SIC 381); 21% for engineering services (SIC 871); 20% for aircrafts and parts (SIC 372); 15% for ship and boat building and repairing (SIC 373); 11% for blank books, loose leaf binders, and bookbinding (SIC 278); and 9% for heavy construction (SIC 160). Direct sales to the federal government are comparatively small in most other industries.” (p.1618)↩︎